


Table of contents
library(sf)
library(rKenyaCensus)
library(dplyr)
Vector attribute data is non-spatial data associated with geographic data. We shall play with geographic data courtesy of rKenyaCensus library that represents census data of 2010.
kenya_sf <- rKenyaCensus::KenyaCounties_SHP %>% st_as_sf()
kenya_sf %>% class()
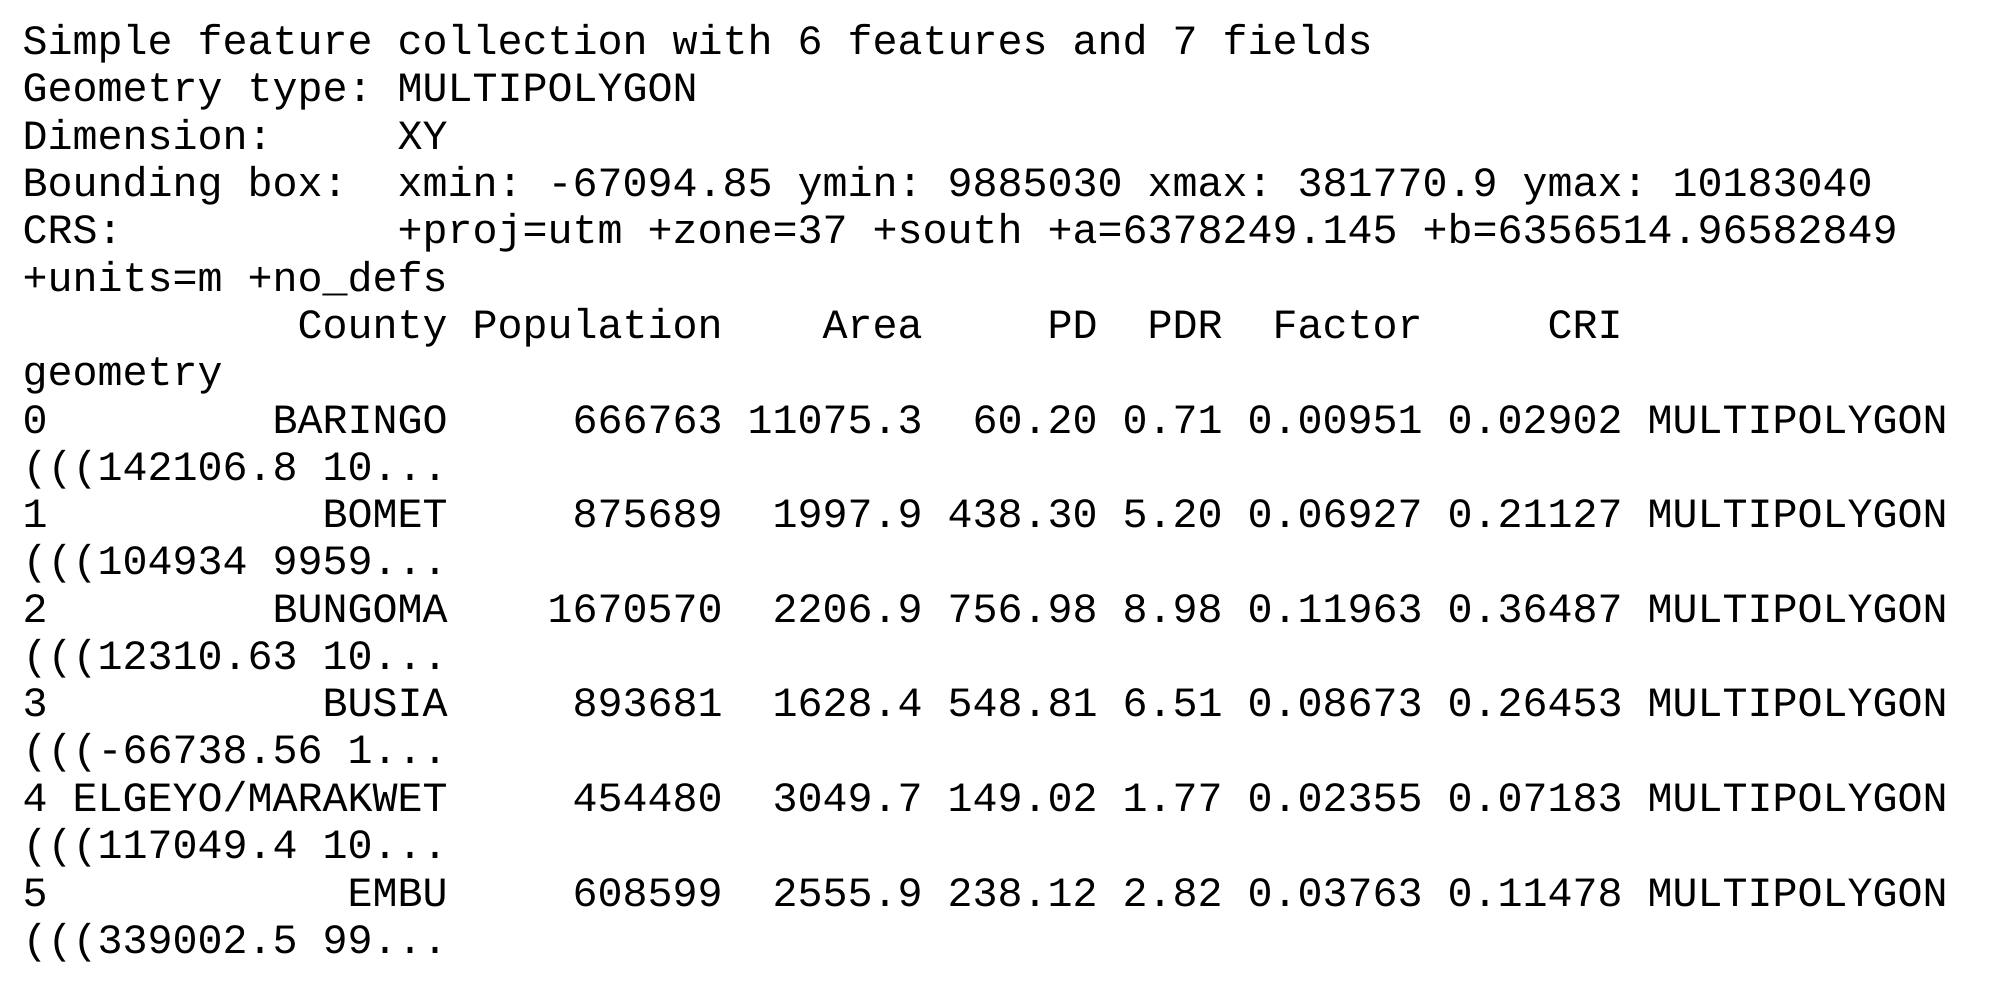
Take a peek into kenya_sf data
head(kenya_sf)
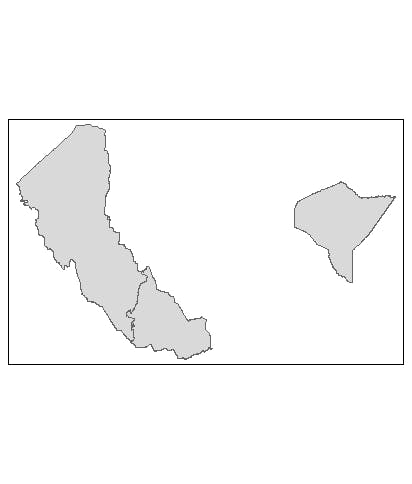
Filtering the sf dataset and plotting
ke_subset_sf <-
  kenya_sf %>%
  filter(County %in% c("TURKANA", "SAMBURU", "MANDERA")) # dplyr filter func

ke_subset_sf %>% qtm()
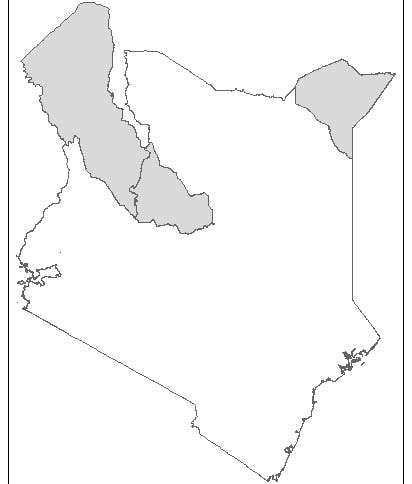
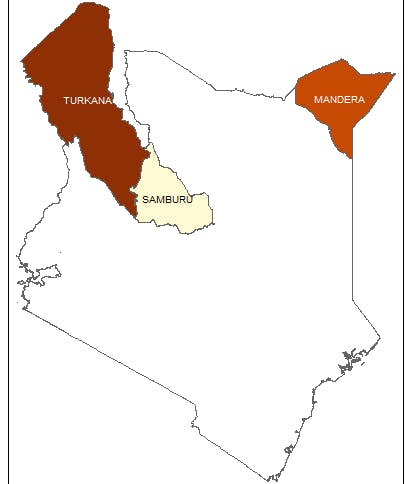
What is we want to get a geographical context in terms of the position of these counties relative to each other in Kenya? We simply add another layer that will represent Kenya.
tm_shape(st_union(kenya_sf)) +
    tm_fill("white") +
    tm_borders() +
    tm_shape(ke_subset_sf) +
    tm_fill() +
    tm_borders()
Vector attribute joining
Assuming we had collected some data on gender in these three counties and we need to merge it into the sf dataset…
gender_kenya <-
  rKenyaCensus::V1_T2.2 %>%  # distribution of population by sex in the counties
  filter(County %in% c("Samburu", "Mandera", "Turkana")) %>%
  select(1:3) # select the first three columns

gender_kenya %>% head()
We shall filter the data to get back the data for the counties of interest.
ke_subset_df <-
  gender_kenya %>%
  filter(County %in% c("Samburu", "Mandera", "Turkana")) %>%
  select(1:3) # select the first three columns

ke_subset_df
Realize that both datasets to be joined have a "County" column in common and therefore we shall join the datasets by that column.
ke_subset_df[, 1] <-
  stringr::str_to_upper(ke_subset_df$County)

ke_subset_df
We shall then use dplyr's left_join to join the two datasets by the County column. This operation successfully merges the two dataframe to give us an sf dataset with new attributes.
new_sf <- left_join(ke_subset_sf, ke_subset_df)
new_sf
Consequently, we can now use the new attributes in our plotting. Though the example below is a little contrived, you can go ahead and use the new attributes.
tm_shape(st_union(kenya_sf)) +
    tm_fill("white") +
    tm_borders() +
    tm_shape(new_sf) +
    tm_fill("Male", legend.show = FALSE) +
    tm_borders() +
    tm_text("County", size = .6)
Thanks for reading.